Viewing Network Statistics for a Dedicated or Colocated Device
You can view Basic Network Statistics for any switch ports that are assigned to devices from within your client portal. More advanced statistics showing source/destination/traffic type are also available if you subscribe to our Gateway Bandwidth Monitoring which provides more indepth and granular graphs and can be accessed via the Netflow Monitoring options in the menu. If would like to subscribe to this service then please raise a support ticket.
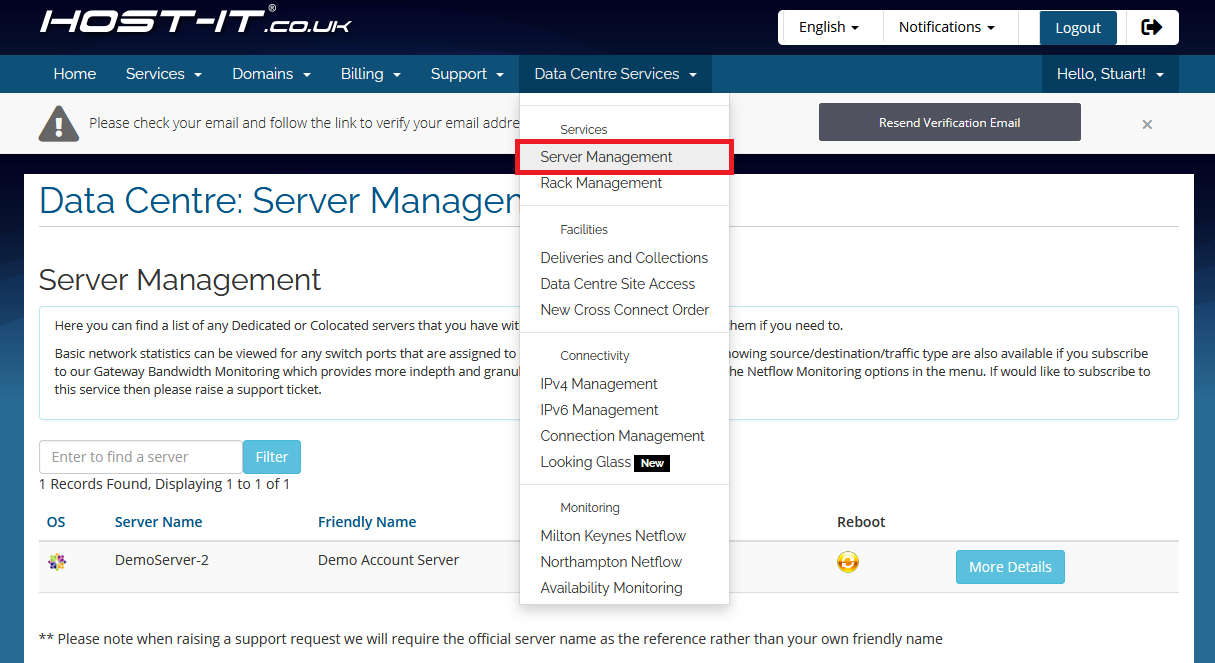
- Open the “Data Centre Services” menu and select "Server Management"

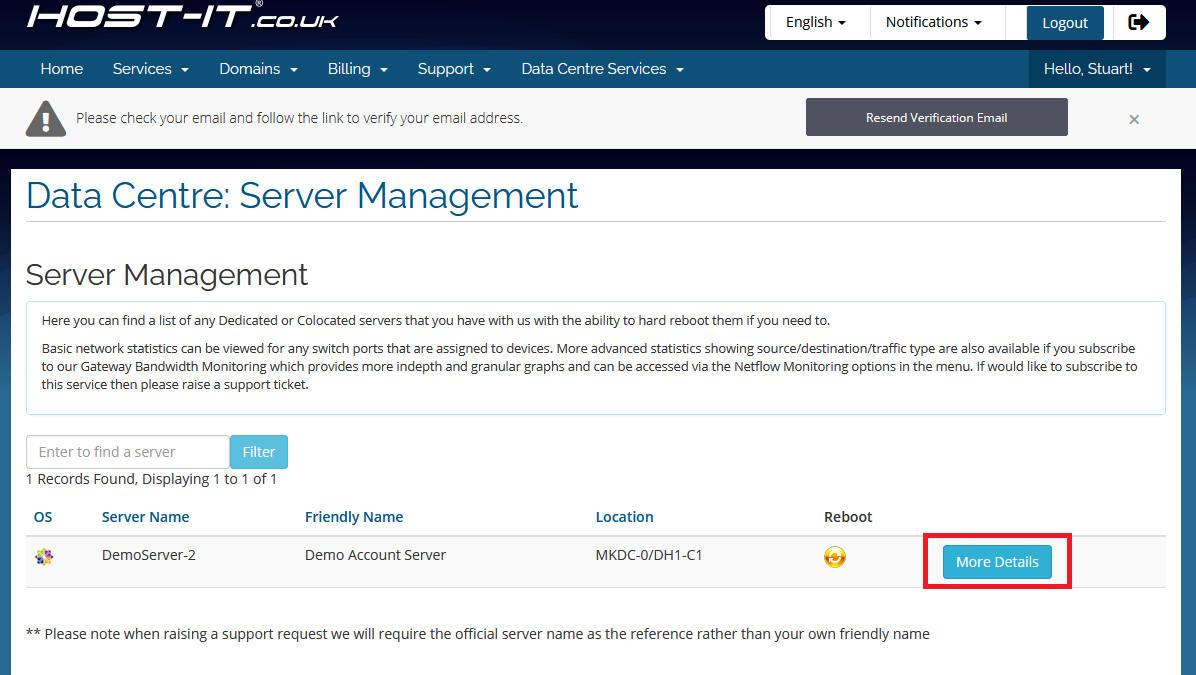
- Locate the server you wish to view statistics for and select "More Details"

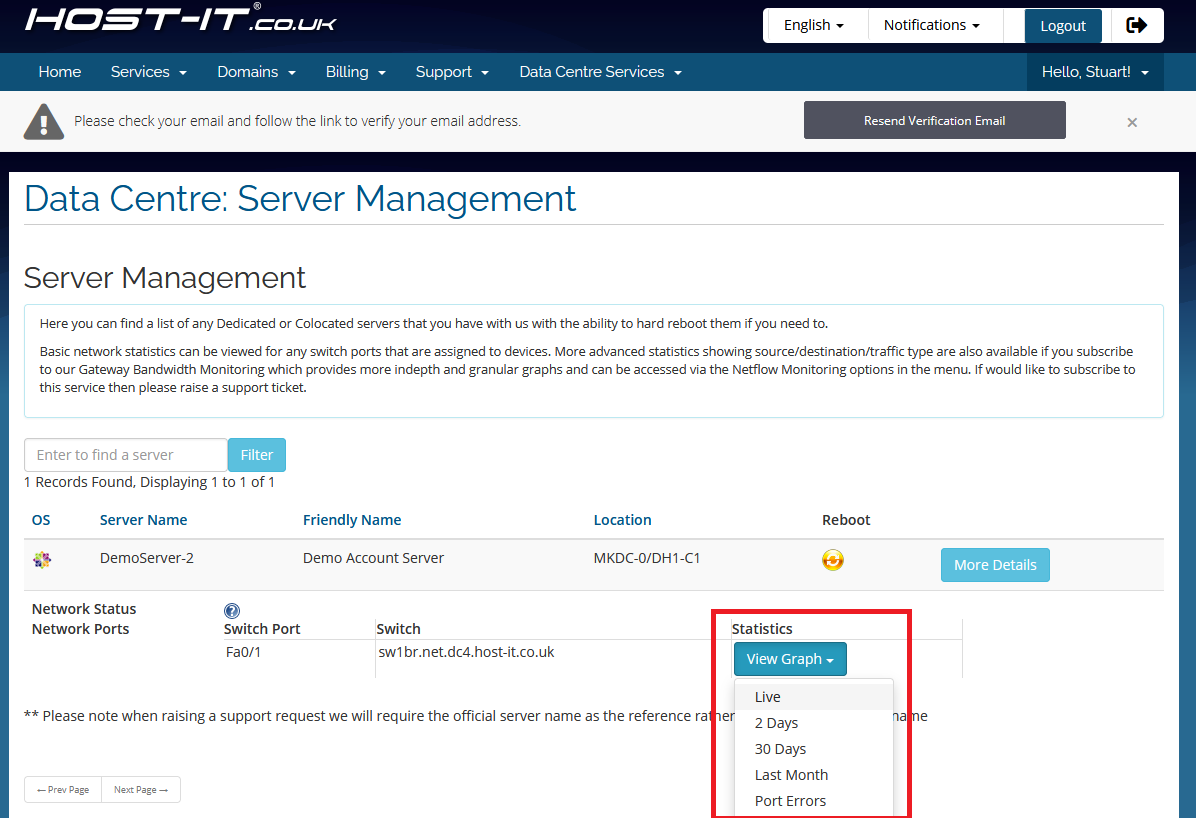
- Now click on the "View Graph" button next to the relevant switch port and select a period

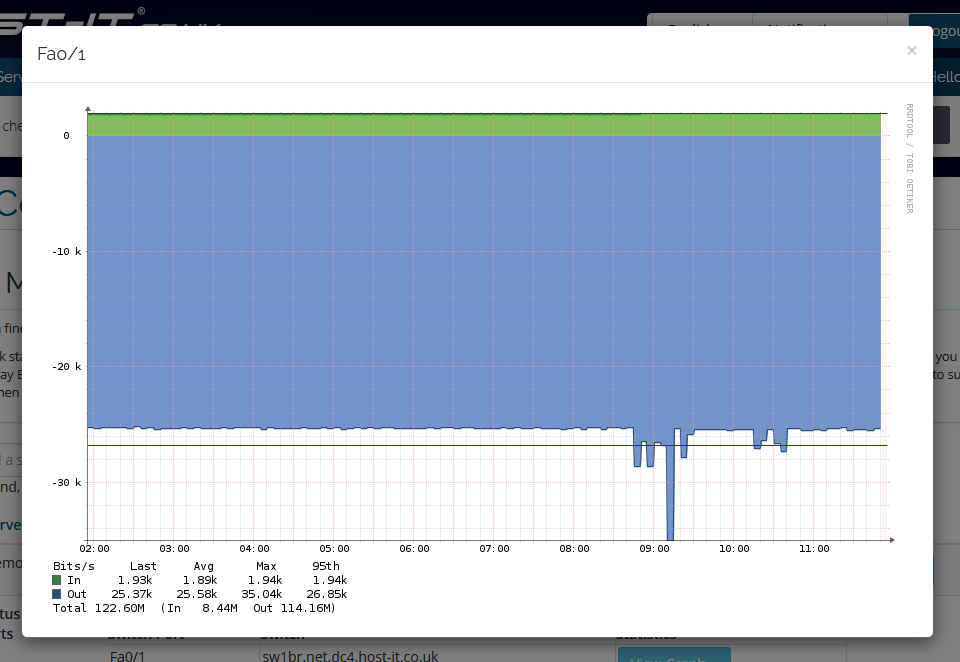
- You should see a popup displaying graph data for the selected period. To close the window simply click off of it and the popup with close


