We utilise Netflow Analyzer to provide flow based insights and billing facilities to our customers. The service takes sflow and netflow data directly from our edge routers in realtime and produces data samples for reporting and billing purposes.
Netflow Analyzer retains data points of varying sizes as listed below.
- RAW Data - This is the raw flow data that's received from the routes and provides the most granularity. We retain this data for a maximum of 1 day due to the volume of storage required for it.
- 1 minute data points - These are granular data point samples that are averaged from the raw data to 1 minute. These are used when viewing short period reports/graphs.
- 5 minute data points - Just like 1 minute data points, these are average but over 5 minutes instead. We use this data point to produce the billing reports that customers receive.
- hourly data points - These are hourly averages which are used for the main traffic report views rather than the indepth reports and are generally used when viewing less granular data over a longer period.
Historical data is retained for up to 2 years, however, 1 and 5 minute granular data is retained for a maximum of 3 months. The older the data, the less granularity there is available within Netflow Analyzer.
For customers that are on non-fixed rate subscriptions the Netflow Analyzer system will calculate the overusage from the start of the clanedar month at 00:00 (UK Time) to the last date of the calendar month at 23:59 (UK Time). The sampling rate used for this billing is based on the 5 minute data points and thus produces an average every 5 minutes. This does mean that you could have potentially used slightly more than is billed but 5 minute sampling is the accepted standard.
It's important to note that if you subscribe to the Gateway Bandwidth Montiroing service from us allowing you access to Netflow Analyzer, you should not compare the "Hourly Average" traffic views with your bill. The Hourly Average views use hourly sample averages and are not comparable and will very likely present a much lower figure to you. Instead, you should utilise the consolidated report option to produce a report based on 5 minute data points.
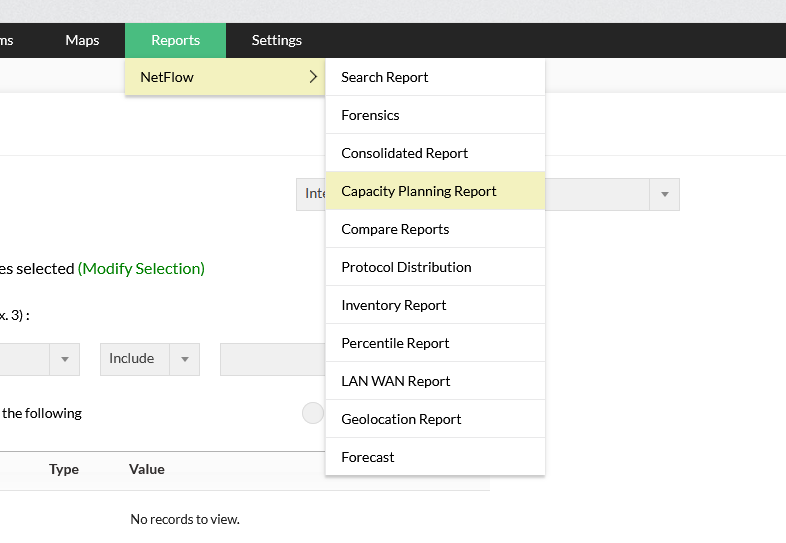
- Select Reports, Netflow, Capacity Planning Report from the main menu.
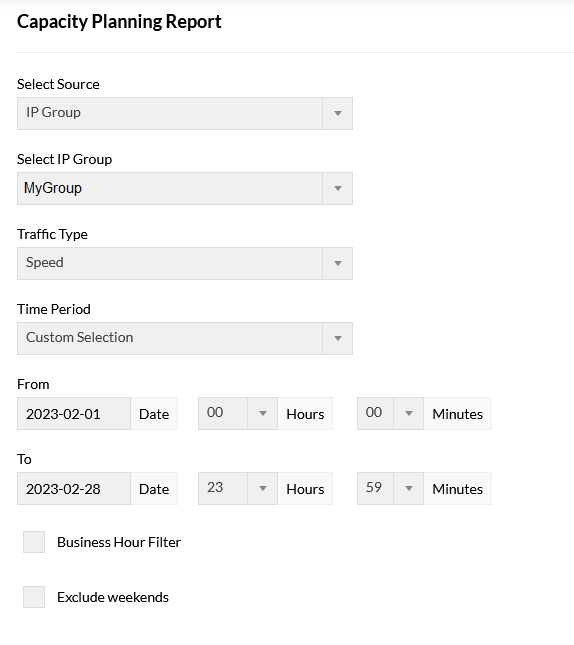
- Next, complete the report form for the desired period and IP Group. The options shown in the image below are the typical values to match what a billed period would show.
- Now select 'Generate Report' from the bottom of the form. Report generation can take a few minutes depending on the period selected due to the number of samples pulled.
